Organic carbon sources of mangrove sediments
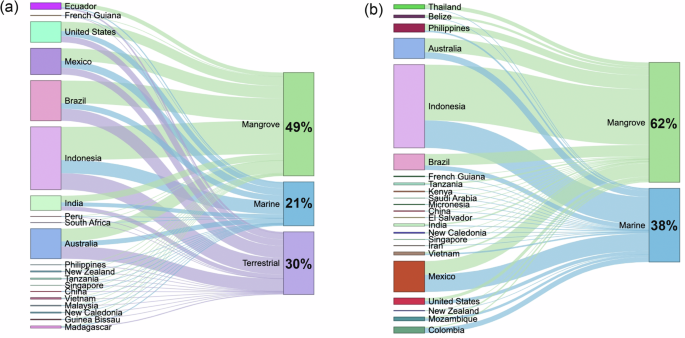
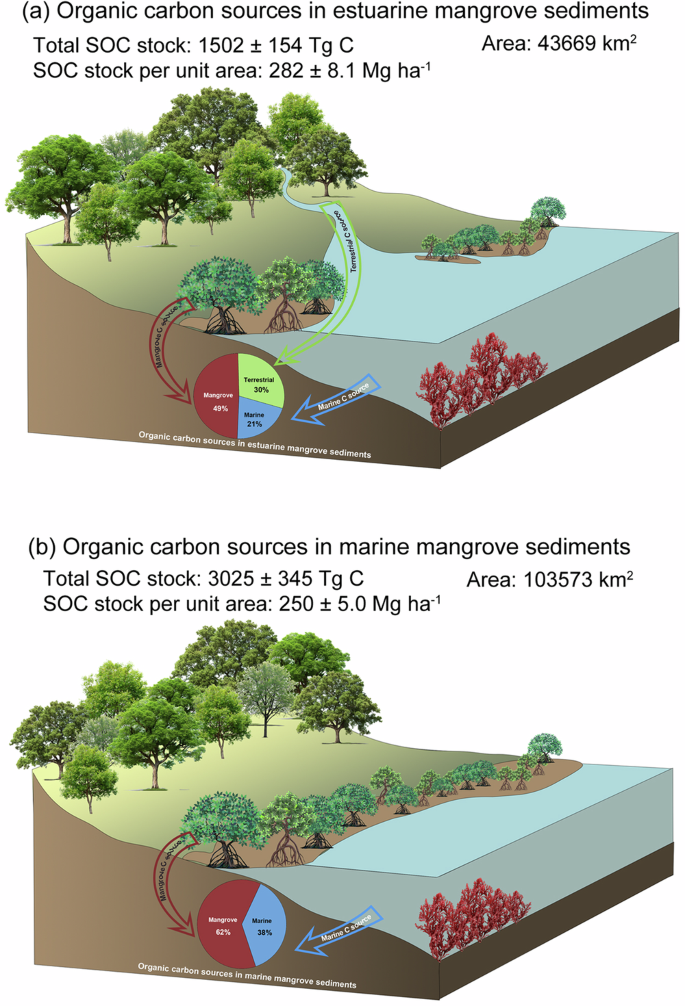
This study first compiled 441 observations of δ13C values of mangrove sediments worldwide, covering most of the mangrove distributed areas (Fig. S1). δ13C values varied from −30.7‰ (Rhizophora apiculata and Avicennia marina forest sediments in Malaysia) to −6.20‰ (Sonneratia alba forest sediments in Tanzania), with the mean value of −25.1‰ (Fig. S1). Surprisingly, the mangrove sediment δ13C value was less influenced by dominant species and CES. Locations (longitude and latitude), tidal range, mean annual temperature (MAT), salinity, total nitrogen content and soil particle size fraction were the main drivers of mangrove sediment δ13C variation (Table S1). Our analysis of global observations revealed that mangrove plant-derived autochthonous OC is the main contributor to the top-meter SOC in both estuarine and marine mangrove sediments, accounting for 49% and 62% respectively (Fig. 1). In estuarine mangroves, terrestrial OC contributed a notable 30%, contrasting with less marine OC deposition (21%) (Fig. 1a). Continental values of autochthonous OC varied from 15% in South Africa to 57% in South America (Table 1). To identify the sources of OC, we considered mangrove litterfall and belowground root production as endmembers, using their mean values for source identification. However, it is worth noting that the contribution of autochthonous OC to the sediment may be underestimated in this study, as mangrove roots and woody materials may have slightly more enriched δ13C values than leaves4, and our dataset primarily consisted of mangrove leaves.
The contributions of different OC sources were significantly influenced by CES, with varying contributions observed across different countries (Fig. 1, Fig. S2, Table. S2 and Table. S3). In marine mangrove sediments, marine allochthonous OC accounted for 38% of the total OC, with autochthonous OC contributing the remaining 62% (Fig. 1b). Individual values of autochthonous OC contribution ranged from 13% in Iran to 92% in Thailand (Fig. 1a and Table. S3). Autochthonous OC contribution was the highest in South Africa (73%) and the lowest in South Asia (35.7%, Table 1). Marine OC contributions tended to increase with particulate organic carbon (POC), while factors like canopy height and mean annual precipitation (MAP) were linked to lower proportional marine OC contributions (Fig. S2a and Figs. S3d, h, j). In estuarine regions, mangrove sediments were found to contain a smaller amount of marine OC compared to terrestrial OC (Fig. 1a), consistent with previous findings11. The marine OC retained in mangrove sediments is highly regulated by carbon accumulation rate (CAR) and POC contents (Fig. S2a). Marine particles usually had low OC content, therefore higher sedimentation of marine particles would cause less particulate organic matter (OM) to be imported into estuarine mangroves12. Instead, abundant POC can continuously provide C sources for mangrove sediments, resulting in more marine OC retained13.
Mangrove autochthonous OC contributions were mainly regulated by location, soil properties, and climatic conditions (Fig. S2b). Autochthonous OC contribution decreased along with longitude (Fig. S4a). Higher MAT and MAP favored plant OC input into soils. Areas with intense anthropogenic activities or greater development might exhibit a greater autochthonous OC contribution (Figs. S4e and l). It is worth noting that areas with high population density exhibit higher autochthonous contributions to sediment OC. Anthropogenic nutrient fluxes can act as fertilizers for mangroves, enhancing their growth and consequently increasing the input of autochthonous OC14,15.
Generally, terrestrial allochthonous OC only contributes to OC in estuarine mangrove sediments, which are more susceptible to anthropogenic activities (Fig. S2c and Figs. S5c, l). Terrestrial OM is abundant in lignin-phenols, while marine OM is characterized by low C/N ratios and simple composition, which might result in the preferential decomposition of light fractions in marine OM11,16. We found that greater GDP and human development index (HDI) were negatively correlated with terrestrial OC contribution (Fig. S5c, l). Anthropogenic activities such as extensive water use for agricultural purposes will reduce the river’s natural flow downstream, which could decrease the C exchange between mangroves and rivers17. Eutrophic estuaries under intense anthropogenic activities have been found to exhibit high OC decomposition, leading to increased C emissions18. Moreover, dam construction might have influence on the terrestrial OC retained in mangroves due to blocking the river and the terrestrial OC transported by the river19.
SOC stocks of estuarine and marine mangroves
The areal extent of estuarine mangroves is far less than marine mangroves, being 43,669 km2 and 103,573 km2, respectively (Fig. 2d, Table. S4 and S5). Globally, SOC stock per unit area was significantly higher in estuarine mangroves (282 ± 8.1 Mg C ha−1) than marine mangroves (250 ± 5.0 Mg C ha−1, P < 0.05, Figs. 2a, b, c). Combining the mangrove distribution and the Kriging interpolation, the SOC stocks of the estuarine and marine mangroves were 1502 ± 154 Tg C and 3025 ± 345 Tg C, respectively (Figs. S6, Table S4 and S5).
SOC stock per unit area in estuarine mangroves (a) and marine mangroves (b) demonstrated as line segments. The bar plot showing the comparison of SOC stock per unit area in global scale (c), where the values are mean ± standard value (SE) and the asterisk (*) shows the significance of P < 0.05. The areal extents of estuarine and marine mangroves are shown (d).
Autochthonous and marine allochthonous contribution to sediment OC in estuarine mangroves was lower than in marine mangroves (Fig. 1), which can be attributed to the additional input of terrestrial allochthonous OC20. Estuarine mangroves held greater SOC stock per unit area than marine mangroves (Fig. 2c), indicating the contribution of terrestrial allochthonous OC to mangrove sediments. The observed pattern was in accordance with that reported by Donato, et al.1. Conversely, Weiss, et al.20 reported a higher sediment SOC stock in marine mangroves (570 Mg C ha−1) than in the estuarine mangroves (310 Mg C ha−1), and a global synthesis showed that marine mangroves presented a greater C density than estuarine mangroves5. The disparity could be caused by variance in sampling size. Previous global synthesis resulted from field sampling of 81 observations from 27 sites5, while this study used a much larger dataset of 2356 observations worldwide. As such, the extensive sampling variance may account for the differences observed in the results.
Despite accounting for only 33% of the global mangrove SOC stock (Fig. 3), estuarine mangroves may face more threats than marine mangroves due to the influx of terrestrial pollutions (including the nitrogen and phosphorus nutrients) carried by rivers, facilitating anthropogenic and environmental changes within estuarine mangrove ecosystems21.
Implications
There is increasing interest in using blue carbon ecosystems (BCEs) for their potential climate mitigation and adaptation benefits through management interventions. This study provided a global dataset of the mangrove sediment OC sources, which can guide future mangrove restoration projects to receive VCS-approved C credits8. Generally, utilized by microbes and transformed into more recalcitrant C (like mineral-associated OC), allochthonous OC can be more stable than autochthonous OC when deposited in mangrove sediments22. This global-scale analysis of the provenance of soil OC sources in mangroves reveals the intricate balance between autochthonous and allochthonous OC contributions to the C sequestration capacity of mangrove sediments. The findings underscore the predominant role of mangrove-derived autochthonous OC in both estuarine and marine settings, while also highlighting the significant, though variable, contribution of allochthonous OC from terrestrial and marine sources8, facilitated by the later C flux. This distinction is crucial for the development and implementation of C crediting mechanisms, such as those prescribed by the VCS8, which require accurate accounting of allochthonous and autochthonous OC sources to ensure that credits support genuine greenhouse gas reduction efforts9. The refinement of our understanding and ability to identify OC sources in these BCEs are important research areas that can lead to improvements of the calculation of C credit.
Moreover, our exploration of how factors such as CAR, POC and socioeconomic variables like GDP and HDI impact the contributions of different OC sources offers vital insights into the anthropogenic and natural processes affecting mangrove carbon sequestration. The correlation between higher GDP and HDI with autochthonous OC contributions, for instance, suggests that economic development and human activities can significantly influence mangrove C dynamics, potentially through the enhancement of mangrove growth via anthropogenic nutrient inputs.
Future research should aim to further refine our understanding of OC sources in mangrove sediments, incorporating additional isotopic analyses and considering the impacts of global challenges such as climate change, deforestation, and land use change. Only through such comprehensive and nuanced approaches can we fully understand the climate mitigation potential of mangroves and ensure the preservation of their invaluable ecosystem services for future generations.


